Data means information. Every information is not valuable for every people. We need to filter relevant information from a huge amount of data by applying statistics and logics using any programming language like Python or R and get the required insights. This is how data science works.
You can work as a Data Scientist if even you are master in Microsoft Excel and I will prove my statement once you will read this post completely.
Secret of Data Science
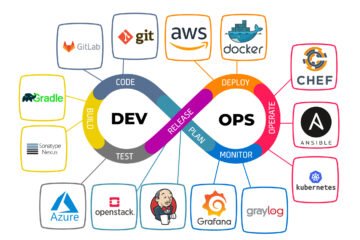
Frequently Used Tools and Techniques
We use below tools and techniques to apply data science on a set of data, but it depends on the complexity of the project and need. A solution architect or team leader is the one who decide the tools and solutions according to the problem and project timeline.

Basic Structure of Data Science
Data + Apply formulas to filter useful data (Example: Python, Excel Etc.) = Insights (Required Data)

Example: Use Case 01
There are 75000 students enrolled in a university. State government has decided to give Rs. 10000 to those students who has scored less than 50 percent overall marks but secured more than 70 percent in mathematics and 80 percent in science. University is using MySQL database to store data.
Solution of Above Task
We can perform above tasks in many ways:
Basic Knowledge of SQL and Excel
- Applicable for the person having access of database and knowledge of sql query.
- Write sql query (Overall marks is less than 50, Mathematics marks 70 and Science marks 80).
- Export the result in excel / csv and send the same for approval and accounting.
- Select columns and draw any “Charts” available in the charts group.
Knowledge of Excel
- This option is applicable for the person having no database access.
- Administrator will give the complete list of students.
- Apply simple filter on columns (Total marks < 50, Mathematics > 70 and Science > 80) and copy the result in a new sheet and send the same for approval.
- Draw any “Recommended Charts” available in the charts group for reference.
Basic Knowledge of Python and Matplotlib Library
- Get total list from the database owner.
- Run simple code in python to cover the given formula, export in excel or csv and send the same for approval.
- Matplotlib library can be utilised to draw a chart.
Conclusion: We can work on data manipulation and visualisation using Microsoft Excel and become a DataScientist. We have options like Python, Matplotlib, Pandas, Spark, SciKit Learn, Hadoop and R programming language, just because of saving our time and make complex logics and statistics simple and repeatable and user friendly.
Thank you for reading this article. Please drop your valuable comments below to make this post more informative and interactive. Stay Safe, Stay Connected. Thank You.


0 Comments